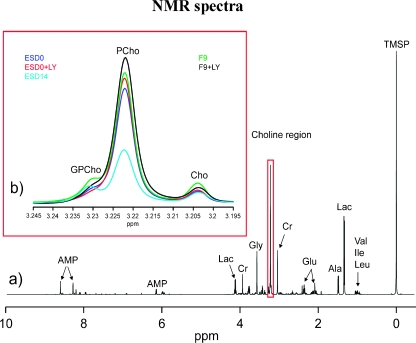
Figure 4.
NMR spectra. (a) Representative 1H NMR spectrum of a mES cell extract. Predominant metabolite resonances are labeled on the spectrum. Val indicates valine; Ile, isoleucine; Leu, leucine; Lac, lactate; Ala, alanine; Gluc, glucose; Cr, creatine; AMP, adenosine monophosphate. (b) Section of 1H NMR spectra (expanded between 3.195 and 3.245 ppm) of mES cells at day 0 with (ESD0 + LY, red line) and without (ESD0, blue line) LY treatment, mES cells after 14 days of growth (cyan line) and teratocarcinoma cell line F9 with (F9 + LY, black line) and without (F9, green line) LY294002 treatment.

