Figure 3.
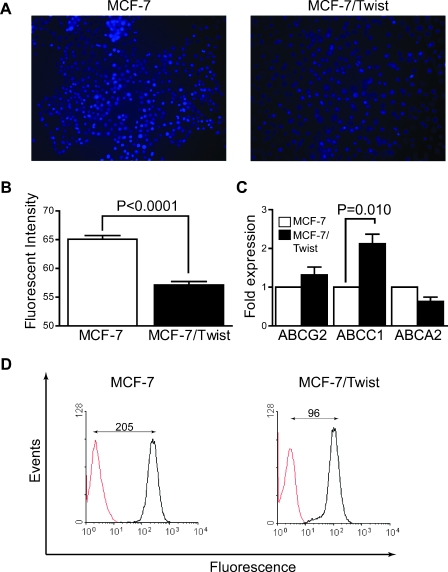
Efflux studies in MCF-7 and MCF-7/Twist cells. (A) Representative photomicrographs of Hoechst efflux staining in MCF-7/Twist cells compared with parental MCF-7 cells. The cells, after efflux, were photographed using a Nikon Eclipse 80i fluorescence microscope. (B) Histogram showing quantification of fluorescence intensity per cell. Cell fluorescence (n = 6) in the blue channel was analyzed using dedicated software developed in IDL programming environment that provides an operator-free segmentation of images and determines the average relative fluorescence per cell. Three images were analyzed per sample. (C) Histogram showing expression of drug transporters ABCG2, ABCC1, and ABCA1 in MCF-7/Twist and parental MCF-7 cells. (D) Histogram showing efflux of Rhodamine 123 stain in MCF-7/Twist and in MCF-7 cells. The amount of Rhodamine 123 dye in the cells was determined by flow cytometry. Results are representative of three separate experiments.

