Figure 7.
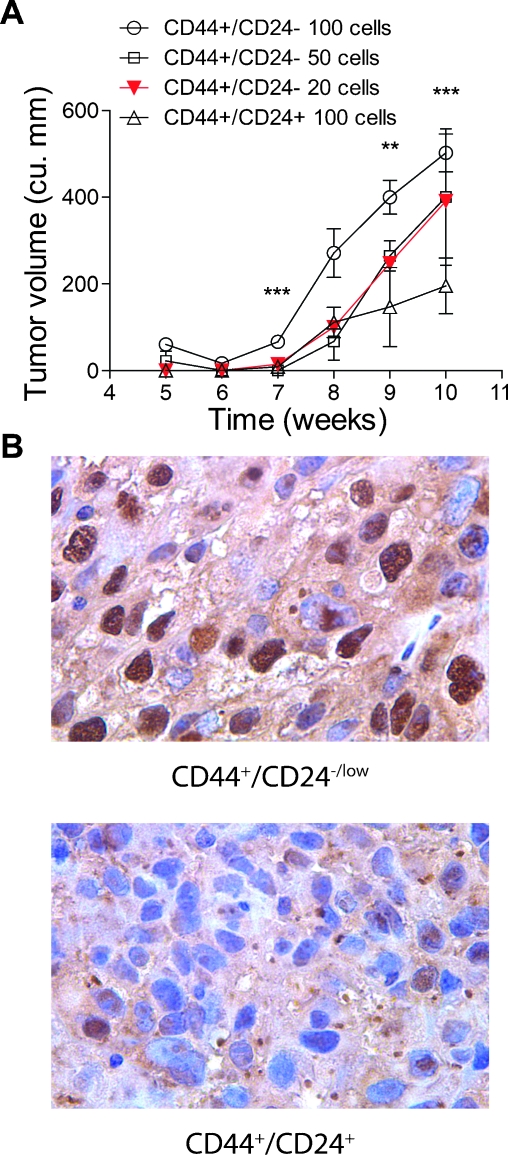
Growth of low inoculums of purified CD44+/CD24-/low and CD44+/CD24+ subpopulations in SCID mice. (A) Graphical representation of growth rates of orthotopic xenograft tumors using flow-sorted cells from the Twist+/CD44+/CD24-/low and CD44+/CD24+ subpopulations. We transplanted 100, 50, and 20 cells of the Twist+/CD44+/CD24-/low subpopulation, and 100 cells from the Twist+/CD44+/CD24+ subpopulation. Four mice per inoculum were used for this study. Significance was analyzed by a two-sided t-test (**P<.05, ***P <.005). (B) Twist immunohistochemical staining of representative tumors from the CD44+/CD24-/low and CD44+/CD24+ subpopulations. Photomicrographs were taken in bright field settings at a magnification of x40 using Nikon Eclipse 80i fluorescence microscope.

