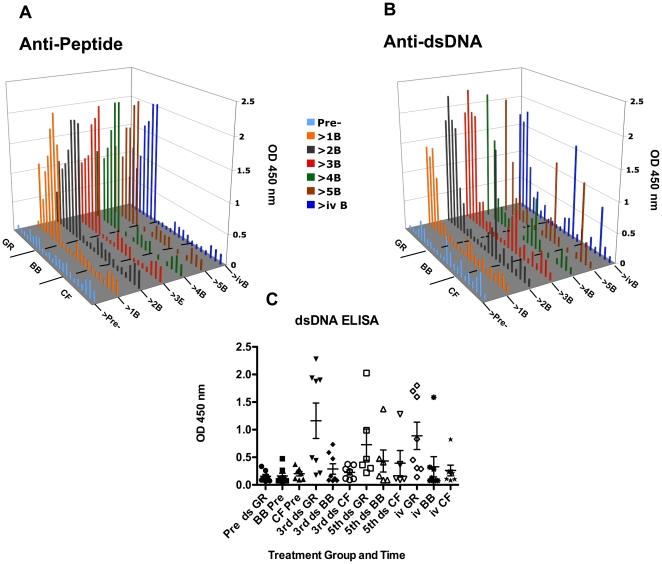
Figure 1. ELISA measurements of anti-peptide and anti-dsDNA responses.
In panels A (anti-peptide B) and B (anti-dsDNA), the pre-immune OD 450 nm values are shown in light blue and the responses after each boost are shown in distinct colors. The low pre-immune values were not subtracted from the post-immune values shown. C. Mean responses of GR-, BB- and CF- immunized rabbits showing high and low anti-dsDNA responders (ds) among GR-MAP-8 immunized rabbits. Each symbol represents an individual rabbit serum tested prior to immunization (Pre ds), after the 3rd, 5th and intravenous (iv) boosts.

