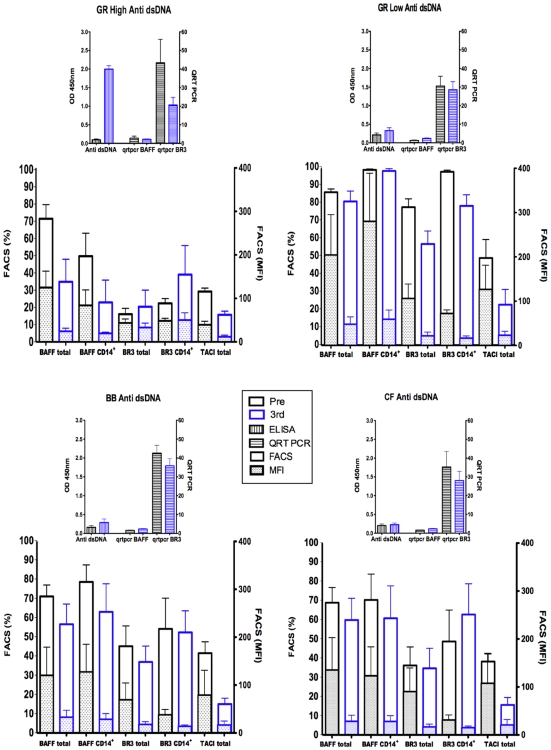
Figure 5. Summary of BAFF and BR3 mRNA expression by Q-PCR, BAFF, BR3, and TACI expression by FACS.
Plotted are means and SEM of results comparing high and low anti-dsDNA responders of GR- immunized with BB- and CF-immunized rabbits (anti-dsDNA OD at 450 nm as determined by ELISA). This overview summarizes results of measurements of pre-immune (Pre) and post boost 3 (3rd) BAFF and BR3 mRNA in total PBMC by Q-PCR [in Table 3, the unit number showing relative mRNA levels in each sample was determined as a value of mRNA normalized against peptidylprolyl isomerase A (PPIA)]. The figure also shows means and SEM of results of FACS analyses of percentages of cells and median fluorescence intensities (MFI) of BAFF, TACI and BR3 (Table S2 and Figure 4) on total PBMC, or CD14+ cell populations from PBMC (the bars are not stacked). In the GR high anti-dsDNA responders, three way ANOVA with repeated measures indicated significant decreases in percentages and MFI of BAFF+ cells among total PBMC (p 0.015 and 0.0002 respectively) as well as MFI on CD14+ cells (p 0.012). Decreased percentage of BAFF+ CD14+ cells was near significance (p 0.06). Decreased percentages of TACI+ cells among PBMC were significant or near significant in GR low, BB and CF groups (p 0.03, 0.013, 0.09 respectively); decreased TACI MFI were also near significant or significant (0.06, 0.07 and 0.03 respectively).

