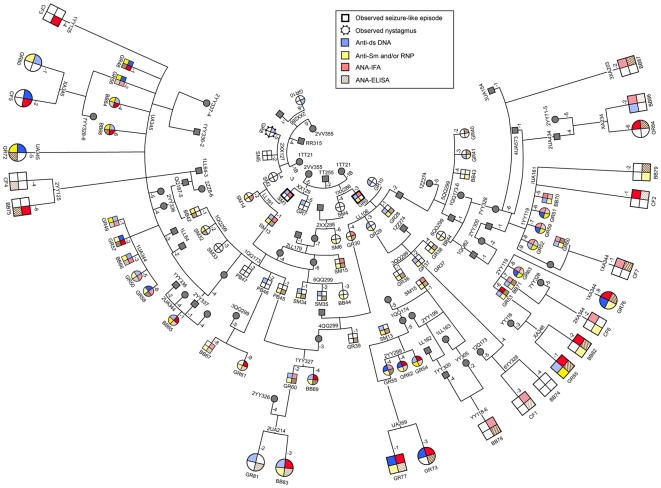
Figure 6. Pedigree and summary of autoantibody responses.
An overview of key ancestors, autoantibody responses, and the relationship of males (large squares) and females (large circles) in the current (group 6) to rabbits in 5 earlier groups is shown. Colors in the four quadrants indicate postimmunization elevations of levels of anti-dsDNA (blue, upper left), anti-Sm and/or anti-RNP (yellow, lower left), ANA by IFA (red upper right) and ANA by ELISA (brown diagonal lines, lower right). For the previous group 5 [9] and present group 6 animals, darker colors indicate high autoantibody responses (Tables 3).

