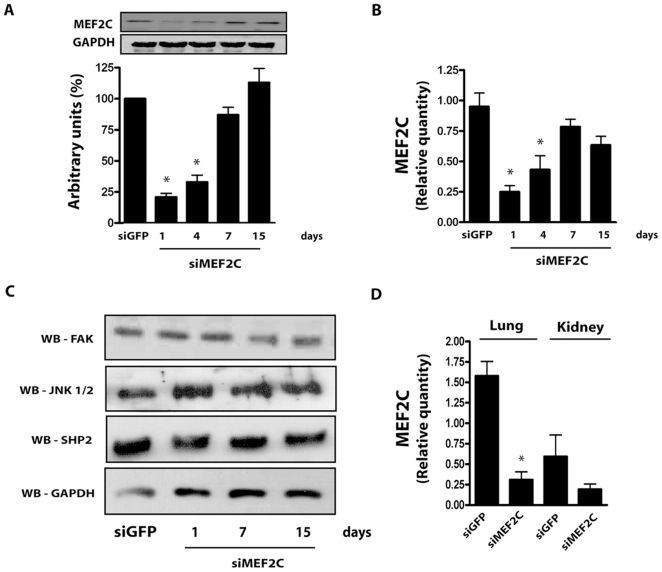
Figure 3. Effects of siMEF2C in distinct tissues and signaling proteins.
(A) Time-course of MEF2C protein expression and (B) transcript levels normalized by GAPDH. (C) Myocardial expression of FAK, JNK, SHP2 and GAPDH. (D) Relative quantity of MEF2C transcripts in mice lung and kidney. * p<0.05 vs treatment with siGFP. At least 5 mice were employed for each subgroup.

