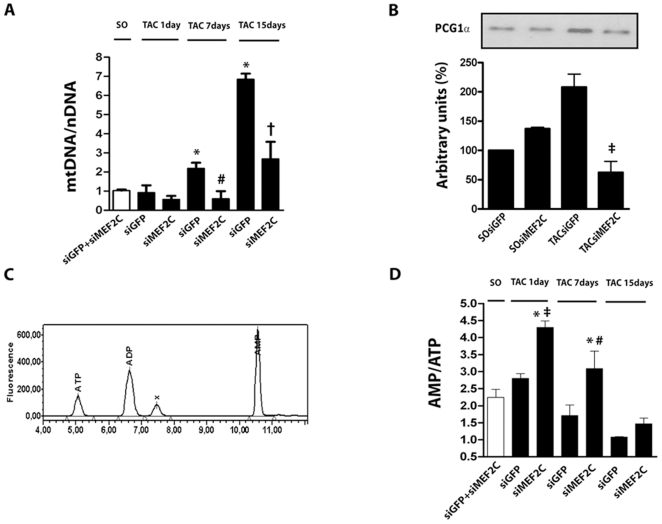
Figure 6. MEF2C silencing negatively regulates myocardial mitochondriogenesis.
(A) Bar graph shows relative quantity (RQ) of mtDNA (mt - mitochondrial) to nDNA (n – nuclear). (B) PGC-1α protein expression. (C) Representative chromatogram of AMP, ADP and ATP detection peaks. (D) Bar graph indicates the average values of the AMP:ATP ratio. The data were from left ventricle of SO and TAC (1 day) mice treated with siMEF2C or siGFP (n = 9 mice each subgroup).* p<0.05 compared with values of SO mice; ‡ p<0.05 compared with values of TAC 1day siGFP mice; # p<0.05 compared with values of TAC 7days siGFP mice; † p<0.05 compared with values of TAC 15days siGFP mice.

