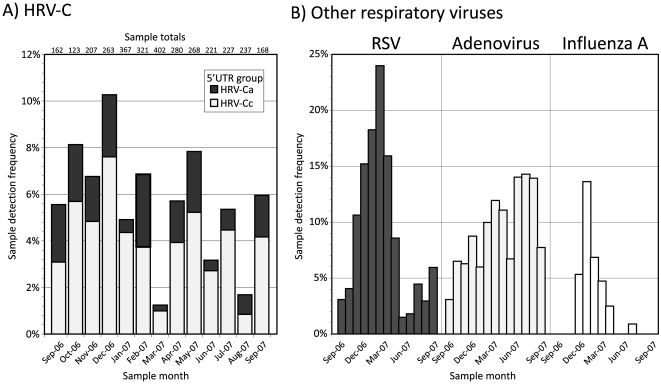
Figure 2. Seasonal distribution of (A) HRV-C positive samples and (B) those positive for other common respiratory viruses.
The y-axis depicts the proportion of samples positive from the total in each category (shown above each bar in part A). Frequencies of HRV-C detection have been subdivided into HRV-Ca and HRV-Cc subgroups.

