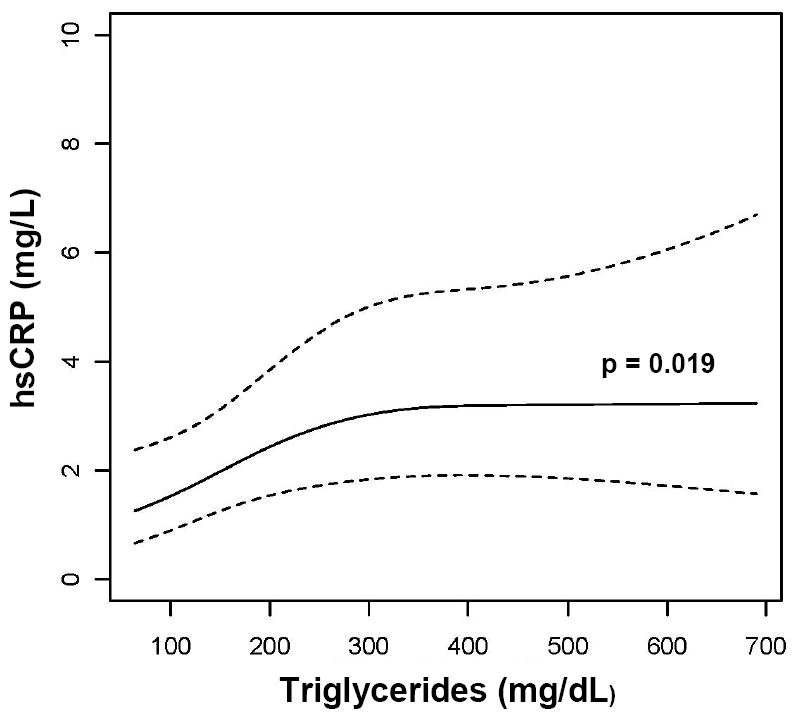
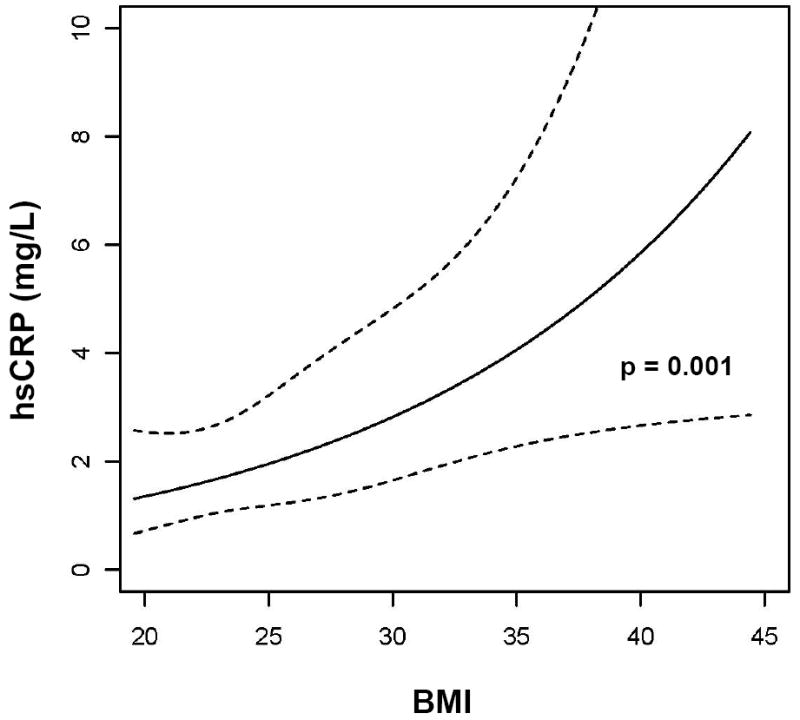
Figure 1.


Association of (A) LDL cholesterol, (B) Non-HDL cholesterol, (C) HDL cholesterol, (D) triglycerides, and (E) BMI with hsCRP. Data are reverse-log-transformed from multivariable repeated measures analysis adjusting for sex, race, age, smoking status, fasting state, CD4+ T cells, HIV-1 RNA, and use of PIs and lipid-lowering therapy. Note: hsCRP = highly sensitive c-reactive protein, LDL = low-density lipoprotein, HDL = high-density lipoprotein, BMI = body mass index, PI = protease inhibitor, R = regression coefficient
