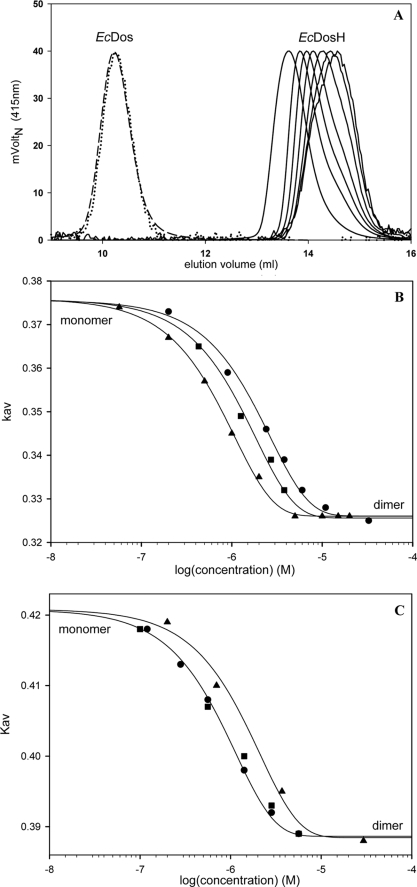
FIGURE 2.
A, normalized gel filtration elution profiles of EcDos (1 μm (– – –) and 0.01 μm (····)) and the heme domain, EcDosH, in a concentration range between 15 and 0.05 μm. B and C, protein size dependence on concentration, as measured by gel filtration. Molecular sieve coefficients, Kav, are plotted versus protein concentration for EcDosH (B) and FixLH (C). Three different forms of each protein were plotted: oxy-ferrous (▴), cyanide-ferric (■), and ferric (●).

