FIGURE 5.
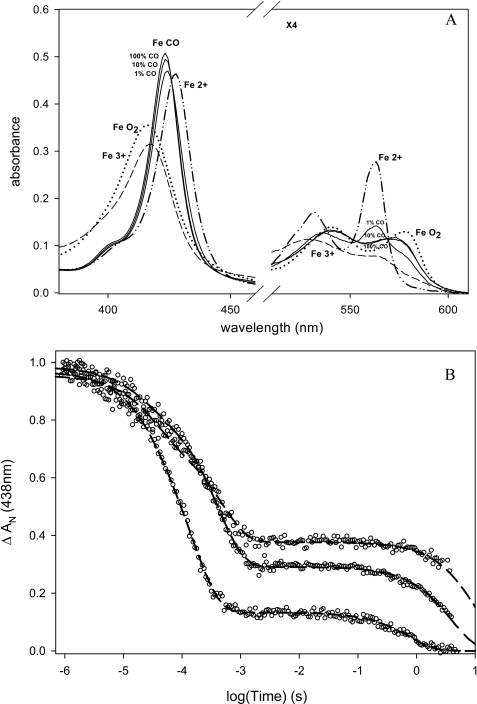
A, absorbance spectra of EcDos in 150 mm acetate buffer, 50 mm NaCl, pH 7.5. – – –, ferric hexacoordinated form; (····, deoxy ferrous hexacoordinated form; ··—··, CO form at 0.01, 0.1, and 1 atm and ferrous oxy form. B, flash photolysis kinetics measurement for EcDos at 438 nm and 25 °C. Recombination kinetics at different CO concentrations is shown (from top to bottom: 0.01, 0.1, and 1 atm of CO). After flash photolysis of CO, the first phase represents competitive binding between CO and Met to the heme sites. The second phase is a slow replacement reaction of Met by CO to return to the preflash steady state.

