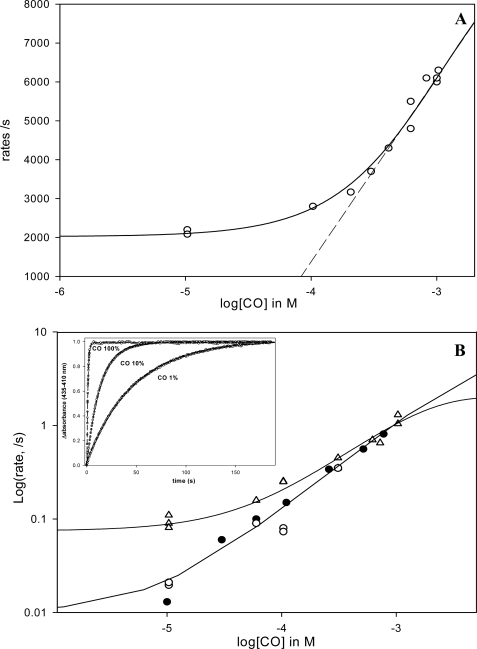
FIGURE 6.
A, fast phase rate for the CO binding kinetics versus [CO] for EcDos. As this phase represents the sum of konMet + konCO at low [CO], one expects the curve to reach a plateau if the Met association becomes the rate-limiting step (konMet ≫ konCO). By contrast, at high [CO] konMet becomes negligible; the asymptote of the hyperbola gives the bimolecular rate. Note that the faster rate for the Met (30,000 s−1), which increases in amplitude at low [CO] as much as the unbound fraction increased at equilibrium, is not shown. Indeed, in this case konMet is much higher than konCO in the range of [CO] investigated, and no [CO] dependence is measurable. B, rate of the slow phase corresponding to methionine replacement by CO by flash photolysis (▵, upper curve). The lower curve shows the rates of methionine replacement by CO measured by stopped-flow (deoxygenated samples are mixed with a CO-equilibrated buffer) (●) and by photoincubation of the deoxy form with repeat flash cycle (10-Hz laser frequency during several seconds) (○). The difference between these curves suggests the presence of two conformations for Met binding to heme with regard to the initial ligation state of the deoxy heme versus liganded heme CO. Inset, replacement of methionine by CO for EcDos after photoinduction (10 s, 10-Hz laser frequency) at different CO concentrations.

