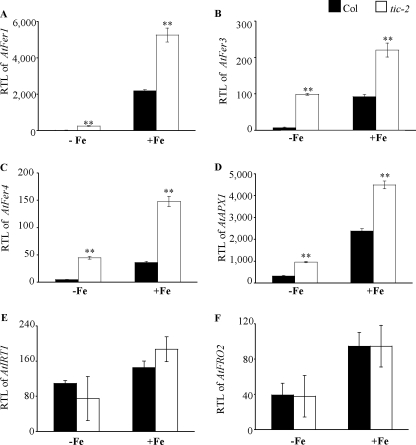
FIGURE 4.
Expression of iron-responsive genes in tic-2. Six-week-old plants, grown in hydroponic condition under iron sufficiency, were submitted to different iron treatments: iron deficiency during 1 week (−Fe) and iron overload for 5 h after 1 week of deficiency (+Fe). The leaves and roots were harvested separately, and RTL were measured by Q-PCR using PP2 (At1g13320), as a housekeeping gene (58). A, RTL of AtFer1 in leaves under iron deficiency and overload. B, RTL of AtFer3 in leaves under iron deficiency and overload. C, RTL of AtFer4 in leaves under iron deficiency and overload. D, RTL of AtAPX1 in leaves under iron deficiency and overload. E, RTL of AtIRT1 in roots under iron deficiency and overload. F, RTL of AtFRO2 in roots under iron deficiency and overload. Black and white bars represent, respectively, Col and tic-2; shown are the means ± S.D. (n = 3); **, p < 0.01 (A–D).

