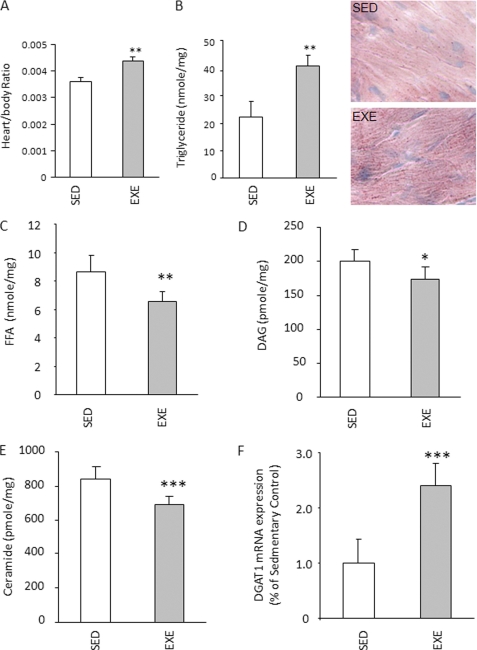
FIGURE 1.
Exercise effects on heart DGAT1 expression and lipid. A, heart to body weight ratio in sedentary (SED) and exercised (EXE) FVB mice (n = 5). B–E, TG, FFA, DAG, and ceramide content in heart muscles isolated from sedentary and exercised FVB mice (n = 5). F, relative DGAT1 expression in exercise group compared with sedentary group, real time PCR (n = 5). *, p < 0.05; **, p < 0.01; ***, p < 0.001.

