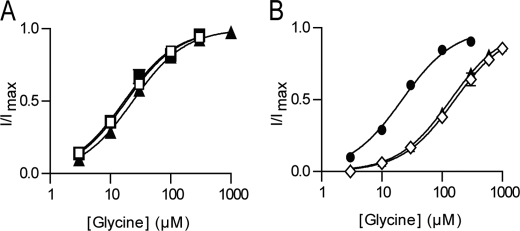
FIGURE 3.
Glycine concentration-dependent transport currents for wild type and chimeric transporters. A, GLYT2 (■), GLYT2(EL2) (□), and GLYT2(EL4) (▴) (n = 5/curve). B, GLYT1 (●), GLYT1(EL4) (▴), and GLYT1(EL2,EL4) (◇). All currents were measured at −60 mV, n = 5, with error bars representing S.E. For most curves, the S.E. errors were smaller than the symbols. See Table 1 for EC50 values for each transporter.

