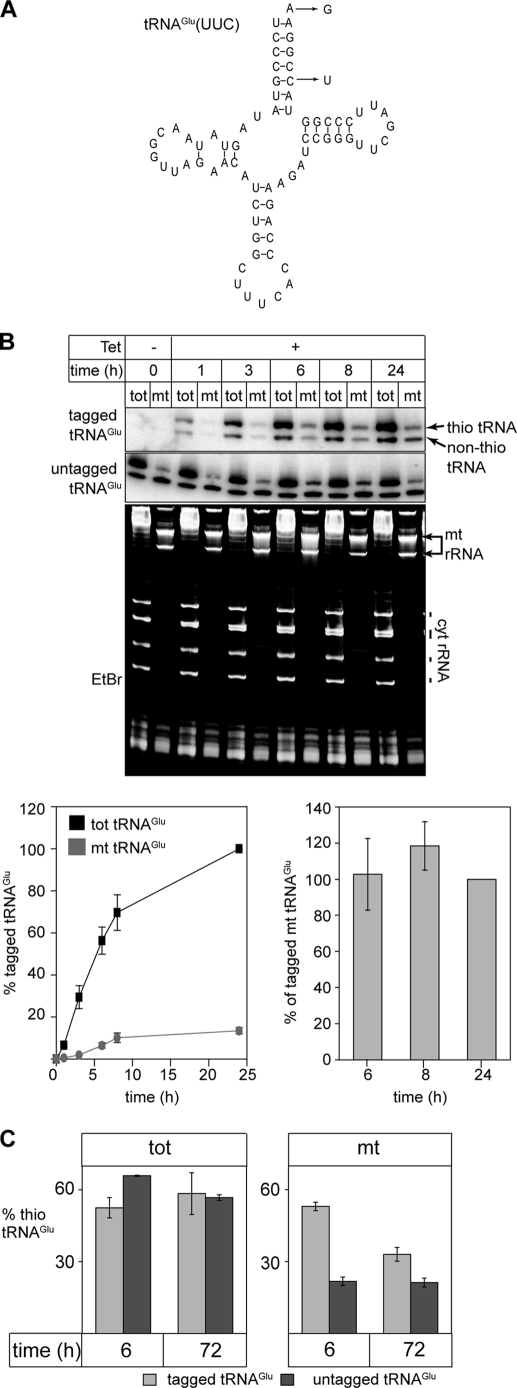
FIGURE 6.
Evidence for dethiolation of tRNAGlu after import. A, predicted secondary structure of the trypanosomal tRNAGlu. The nucleotide changes that were introduced to tag the tRNAGlu that can be specifically detected by oligonucleotide hybridization are indicated. B, inducible expression of tagged tRNAGlu. Appearance of tagged tRNAGlu (upper panel) as well as the endogenous wild-type tRNAGlu (middle panel) in the cytosol (tot) and in digitonin-extracted mitochondria (mt) was monitored by Northern analysis. The RNA samples were separated on APM gels to distinguish thio-modified from non-thio-modified tRNAsGlu. The bottom panel shows the corresponding ethidium bromide-stained gel (EtBr). Positions of the mitochondrial rRNAs (mt rRNA) and the cytosolic (cyt rRNA) as well as the tRNA region are indicated. Graph, bottom left: quantitative analysis of four independent experiments of the type shown on the top panels. The signal corresponding to the tagged tRNAGlu in the total RNA fraction at 24 h of induction was set to 100%. Graph, bottom right: comparison of relative amounts of tagged tRNAGlu (both thio-modified and non-thio-modified) that are recovered in mitochondria after 4, 6, and 24 h of induction, respectively. The fraction of the mitochondrial tagged tRNAGlu after 24 h of induction was set to 100%. Standard errors are indicated. C, percentages of thiolated tRNAGlu* (light gray bars) and of thiolated endogenous wild-type tRNAGlu (dark gray bars) were determined 6 and 72 h after induction in both the cytosolic (tot, left panel) and the mitochondrial fractions (mt, right panel). The graphs depict the mean of three independent experiments (standard errors are indicated).

