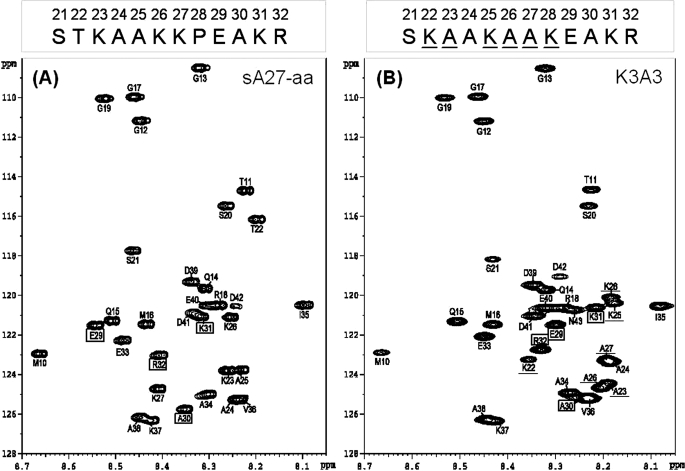
FIGURE 3.
NMR structural analyses of sA27-aa and K3A3. A, two-dimensional 1H-15N HSQC NMR spectra of the parent sA27-aa. B, HSQC spectrum of the scrambled HBS sequence mutant K3A3 at pH 5.0. The respective GAG-binding sequences are shown above the spectrum with the mutated residues underlined. Due to protein self-assembly, only the residues of the flexible HBS were observable (for details, see the text). The respective sequential assignments were achieved on the basis of three-dimensional HNCA and HN(CO)CA NMR experiments (43), and the inter- and intra-residue chemical shift correlations were determined (supplemental Table S2). Residues are boxed if a substantial chemical shift difference was found in the spectra. Single letter abbreviations for amino acids are used. The numbering is based on the sequence of wild type A27. C, 1HN; D, 13Cα; and E, 13CO chemical shift propensity index analysis of the GAG-binding sequences of sA27-aa and K3A3. The chemical shift index was determined as (δ-δrandom)/(δβ-δrandom), where δ is the experimental chemical shift and δβ and δrandom the chemical shift values reported in the literature for a β-structure and random coil, respectively. In the KKPE-binding motif of sA27-aa, the propensity index is around +0.5, suggesting a β-turn conformation, whereas in K3A3, no such structure is seen. The sequence numbering for sA27-aa (single letter code) is shown on the horizontal axis. F, two-dimensional 1H-15N HSQC NMR spectra of sA27-aa interacting with HP, respectively. Spectrum of 0.6 mm [15N]sA27-aa protein without HP (red) is overlaid with the spectrum of the protein after the addition of HP (blue). In sA27-aa, for residues such as Ala25, Lys26, Lys27, Glu29, and Ala30, chemical shift perturbations are greater than 0.01 ppm, suggesting that these residues are involved in specific HP binding. For other residues, namely Ser21, Glu33, Ala34, chemical shifts were unperturbed, suggesting that these are not involved in the HP binding. Insets showed expanded regions for some of these residues. G, two-dimensional 1H-15N HSQC NMR spectra of K3A3 interacting with HP, respectively. Spectrum of 0.6 mm [15N]K3A3 protein without HP (red) is overlaid with the spectrum of the protein after the addition of HP (blue). Weight ratios of protein to HP are 1:0 (red), and 1:5 (blue).


