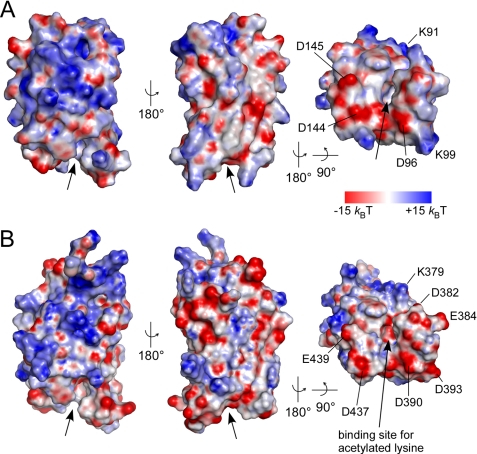
FIGURE 3.
Electrostatic surface potential of the two Brd4 bromodomains. Displayed is the electrostatic surface potential from −15 kBT (red) to +15 kBT (blue) for BD1 (A) and BD2 (B). The binding site for acetylated lysines is indicated by arrows. Acidic residues on helices αZ″ to αA and the BC loop form negatively charged surfaces surrounding the interaction cleft of both bromodomains (right panel).

