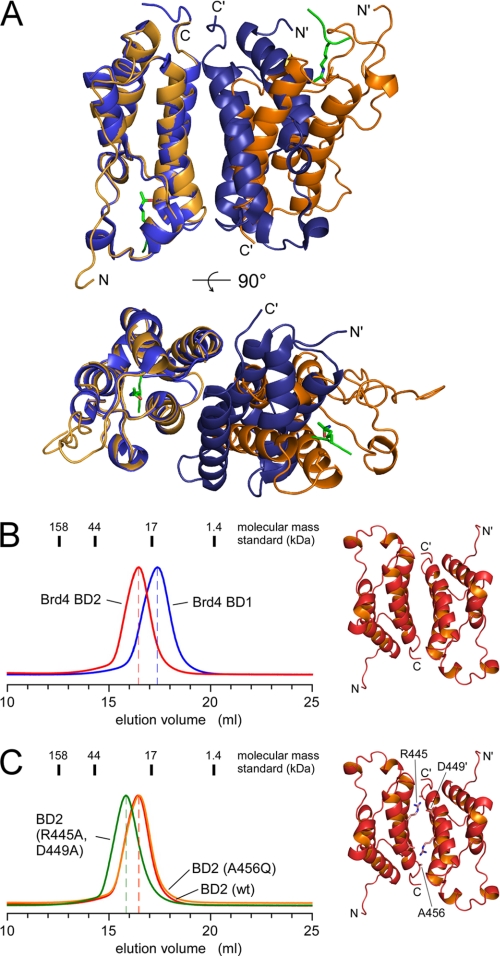
FIGURE 7.
Size exclusion chromatography of Brd4 bomodomains. A, overlay plot of the Brd2 BD1 dimer (1X0J, Ref. 38; blue) with the crystal mates of Brd4 BD1 (3JVJ, this study; orange). The bromodomains on the left side are aligned to each other, whereas the orientation of the bromodomains at the right side varies significantly. B, elution profiles of Brd4 BD1-(51–168) and Brd4 BD2-(349–464) separated by the elution volume in 50 mm Hepes buffer (pH 7.5), 50 mm NaCl, and 1 mm TCEP. Despite similar molecular masses of 14.2 kDa (BD1) and 13.9 kDa (BD2) the second bromodomain eluted significantly earlier suggesting an increased molecular size. C, mutations of residues R445A/D449A (green line), or A456Q (orange line) in Brd4 BD2, that contribute to the crystallographic dimer interface, did not change the elution profile toward smaller volumes, suggesting a monomeric state in solution.

