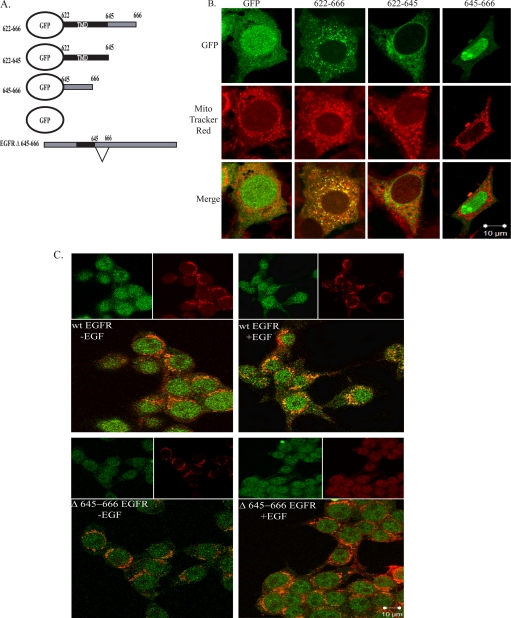
FIGURE 7.
Analysis of the mitochondrial localization signal in the EGFR. A, eGFP-EGFR mutant plasmids is shown. B, 10T1/2 cells overexpressing c-Src were nucleofected with plasmids encoding either GFP alone, GFP-TMD-645–666, GFP-TMD, or GFP-645–666. Cells were cultured and processed as described under “Experimental Procedures.” 90–95% of cells that expressed the various GFP fusion proteins displayed the congruent phenotype shown. The number of cells counted per fusion protein was as follows: GFP, 9; Δ622–666, 15; Δ622–645, 7; Δ645–666, 6. C, HEK 293T cells were transfected with plasmids encoding wt EGFR or EGFR Δ645–666. Cells were processed as described under “Experimental Procedures.” Green, GFP constructs or EGFR (as indicated); red, MitoTracker; yellow, merge of green and red.

