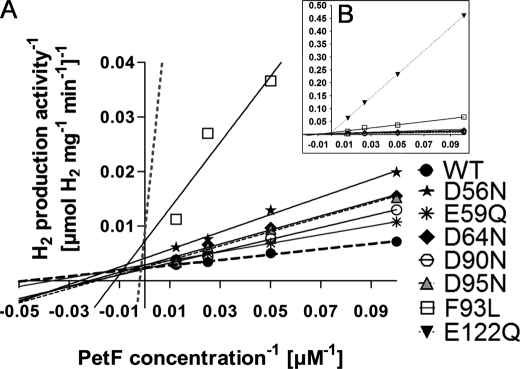
FIGURE 3.
Lineweaver-Burk plot of the HydA1 in vitro hydrogen production activity under increasing concentrations of PetF wild type or PetF mutant proteins. A, in vitro tests were anaerobically prepared as described in Fig. 2. B, larger scale to depict the strongly deviating graphs of E122Q and F93L. Each value represents the mean of at least three independent assays. For the sake of clarity, error bars are not presented in this figure. WT, wild type.

