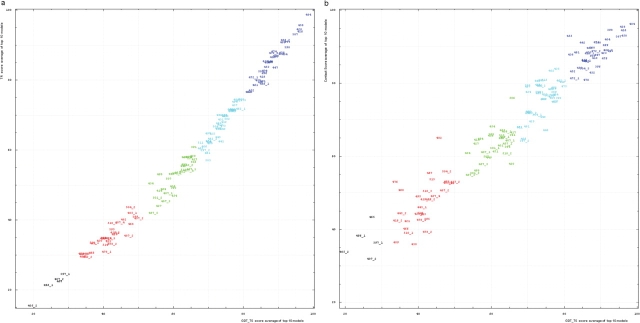
Figure 5.
(a) Correlation between TR score (vertical axis) and GDT-TS (horizontal axis). (b) Correlation between contact score CS (vertical axis) and GDT-TS (horizontal axis). Scores for top 10 first server models were averaged for each domain shown by its number positioned at a point with the coordinates equal to these averaged scores. Domain numbers are colored according to the difficulty category suggested by our analysis: black, FM (free modeling); red, FR (fold recognition); green, CM_H (comparative modeling: hard); cyan, CM_M (comparative modeling: medium); blue, CM_E (comparative modeling: easy).

