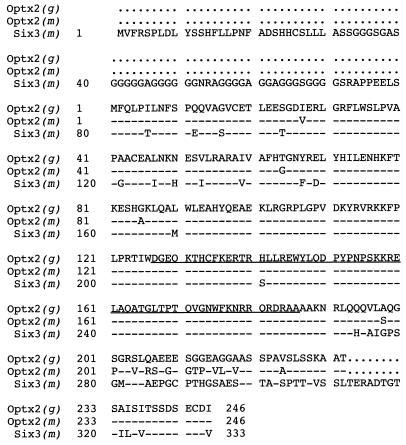
Figure 1.
Comparison of Chicken Optx2 amino acid sequence with Mouse Optx2 and Six3. Top line: chicken Optx2 amino acid sequence. Line indicates homeodomain. Second line: mouse Optx2. Third line: mouse Six3. Dash: identity to chicken Optx2. Dots indicate absence of corresponding amino acid, such as in the N terminus of Six3.

