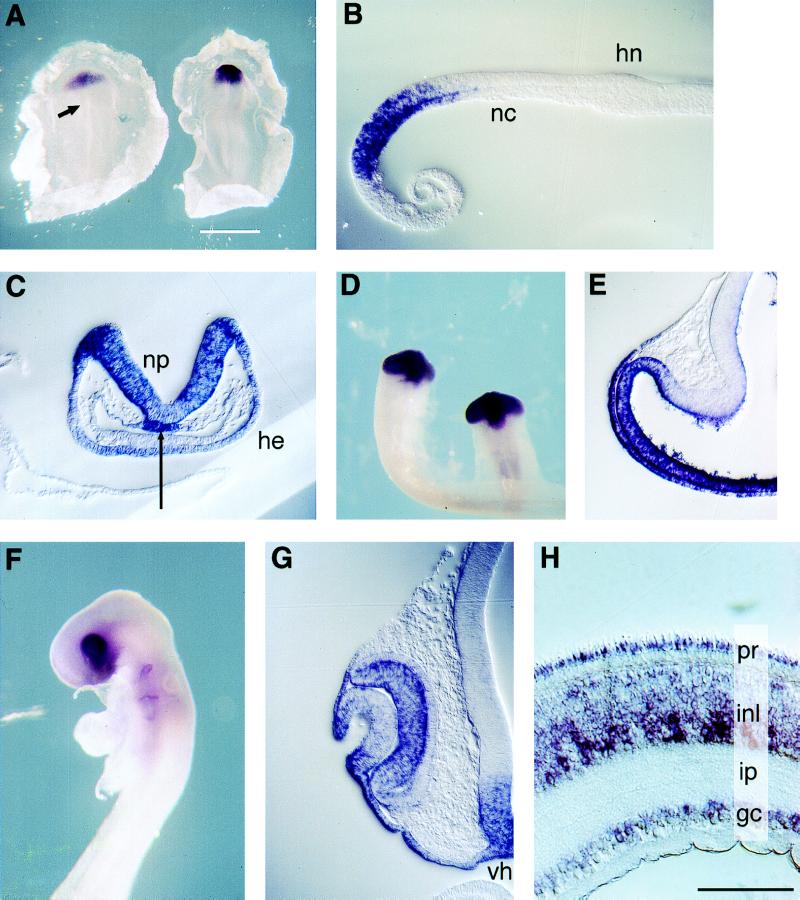
Figure 3.
Expression of Optx2 during chicken development. Wholemount in situ hybridization of embryos and explants; 10 μm sections. Orientation: dorsal up (B–G). Blue/purple signal: Optx2 mRNA. (A Left) Gastrula (st 5), dorsal view, anterior up. Signal in eye field region. Arrow: Hensen’s node. (A Right) Neural plate embryo (st 7). Signal in prospective forebrain and head ectoderm. (B) Stage 5 embryo, sagittal section, anterior left. Signal in prechordal mesoderm and overlying ectoderm of eye field. nc, notochord; hn, Hensen’s node. (C) Neural fold embryo (st 7+) transverse section through forebrain. Signal in neural plate, head ectoderm, and prechordal plate (arrow). (D) Optic vesicle stage (st 11), ventral view. Signal in the ventral forebrain and optic vesicles, with none detected at more posterior levels of the head or body. (E) Optic vesicle, forebrain (st 12+), transverse section, midline on the right. Optx2 signal restricted to distal and ventral optic vesicle, ventral forebrain. Note signal in optic vesicle neurectoderm and overlying surface ectoderm (lens placode). (F) Optic cup stage embryo (st 16). Signal in branchial arch clefts is an artifact. (G) Stage 16, transverse section, eye faces left. Note absence of signal in outer layer of optic cup (RPE). Decreased signal in the central lens placode, in contrast to the future cornea and conjunctiva. Signal in ventral hypothalamus (vh) and overlying ectoderm. (H) E17 chicken neural retina. Cone outer segments visible on upper edge of specimen. Optx2 mRNA is detected in all cell layers, including photoreceptor inner segment. pr, photoreceptors; inl, inner nuclear layer; ip, inner plexiform layer; gc, ganglion cells. (Scale: A, white bar = 1,000 μm; B, C, E, and G white bar = 100 μm; D, white bar = 500 μm; E, white bar = 300 μm; and H, black bar = 50 μm).

