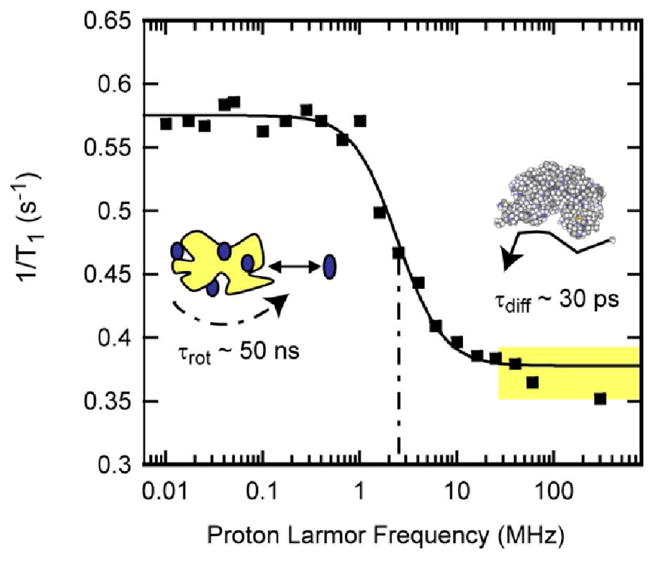
FIG. 1.

Proton spin-lattice relaxation rate constants as a function of magnetic field strength plotted as the Larmor frequency for 150 μM bovine serum albumin in H2O purged with nitrogen gas at laboratory temperature at 22°C. The solid line is a Lorentzian fit and reports the rotational correlation time of the protein at 45 ns [48]. The region marked in yellow above the rotational dispersion is dominated by relaxation events at the protein interface and is the focus of this work.
