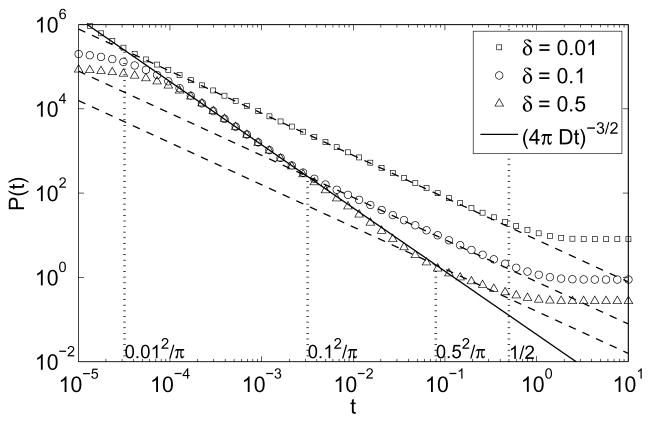
FIG. 5.
The probability density P(t) for a walker to return to the starting boundary point on the inner boundary of a spherical layer of inner radius R, outer radius R + δ = 1, and thickness δ: δ = 0.01 (squares), δ = 0.1 (circles), and δ = 0.5 (triangles). The corresponding dashed lines show the t−1 behavior in the intermediate regime, while the black solid line shows the very short-time behavior t−3/2. The first three vertical dotted lines indicate the crossover times tmin = δ2/π for each spherical layer, the last one gives tmax = 1/2 (with D = 1). For very small times, one can notice an unphysical deviation from the very short-time asymptotic behavior (for δ = 0.1 and δ= 0.5) because of an insufficient number of the eigenvalues used in numerical computation.

