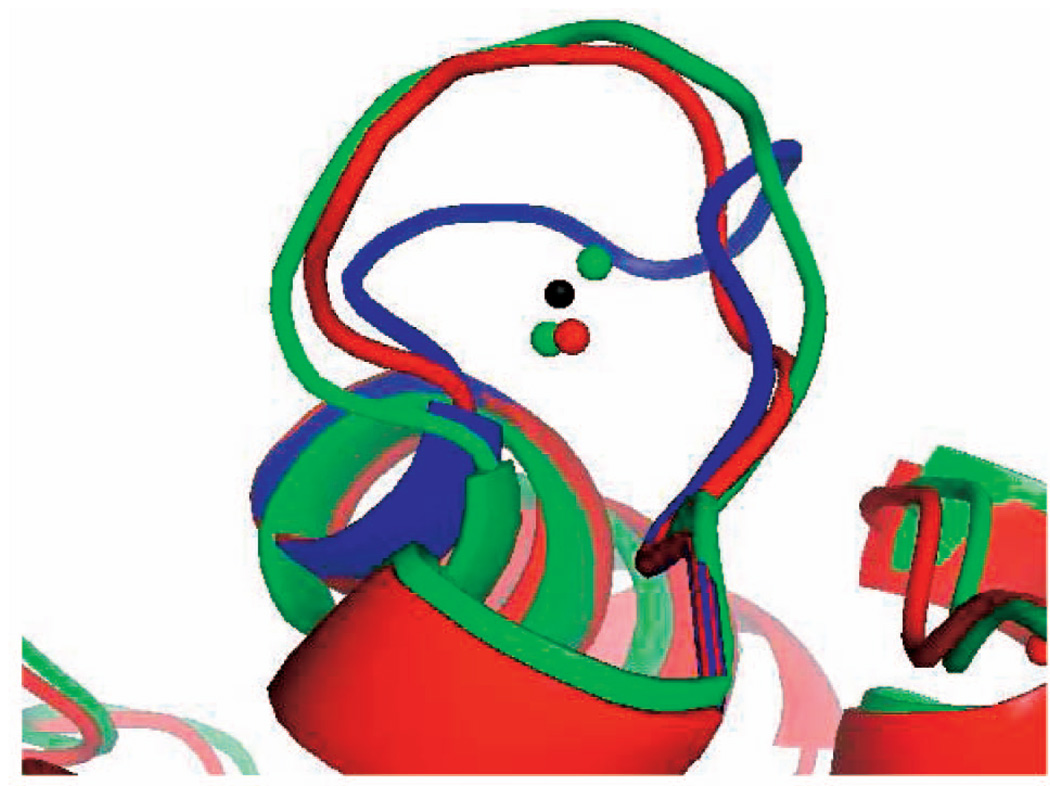
Fig. 9.
Parvalbumin loop ALA51-ILE58: The apo and holo conformations recorded in the PDB are shown in blue and green, respectively. The loop conformation in red is the conformation generated by seed sampling and recognized by FEATURE as a calcium-binding site. The black dot is the position of the calcium ion recorded in the PDB. The green and red dots are the calcium positions predicted by FEATURE for the loop conformations of the same color.

