
Figure 3.
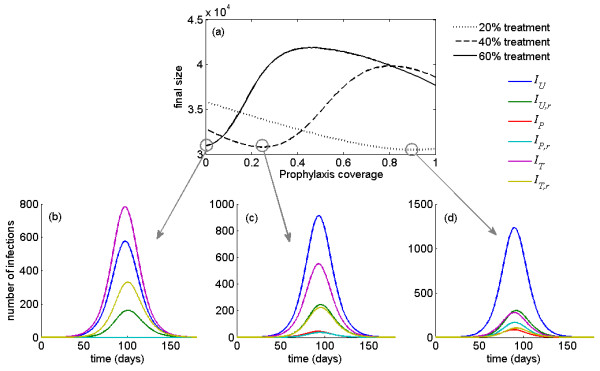
Optimal prophylaxis coverage for various treatment levels with the corresponding time-courses of epidemic. (a) Total number of infections (final size) as a function of prophylaxis coverage of close contacts for different treatment levels with  = 1.6. For the minimum final size corresponding to each treatment level (circled in (a)), the time courses of disease outbreaks are illustrated in (b), (c) and (d) for both sensitive and resistant infections. Each curve in the lower panel of the figure represents an epidemic curve for a given treatment group (U = untreated, P = propylaxed, T = treated), with subscript r denoting whether or not the virus is resistant to antiviral drugs.