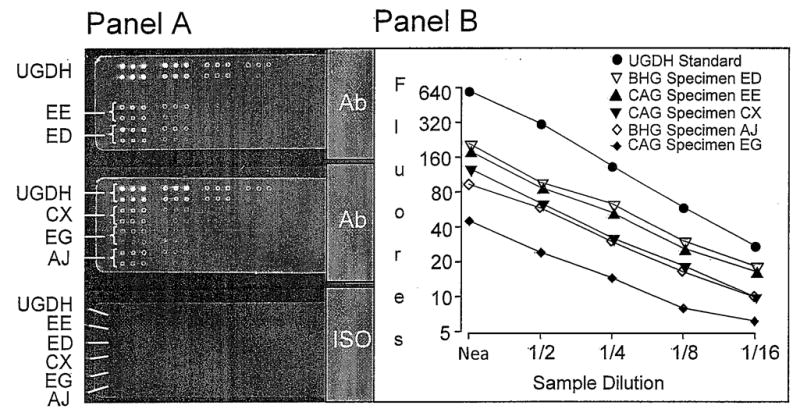
Figure 3. Reverse-Phase Protein Array analysis of UGDH in slide specimens of prostate tissue.

Slices of two benign hyperplastic (BHG; specimens ED and AJ) and three cancerous (CAG; specimens EE, CX, and EG) glands were fixed in methacarn, embedded in paraffin and sectioned at four microns. One slide specimen of each gland was shaved from its slide and deposited in extraction buffer. Panel A. Serial two-fold dilutions of the extracts and human rUGDH standard (10 μg/100 μL) were spotted (40–50 nL/spot) in triplicate to nitrocellulose slides that were probed with anti-UGDH antiserum (Ab) and labeled with IRDye 800 CW conjugated goat anti-rabbit IgG. Slides were scanned with an infrared imaging system. Each specimen (EE, ED, CX, EG, AJ) and recombinant UGDH is represented by two rows of spots. Top row, dilutions of 1/1, 1/4, 1/16, and 1/64; bottom row, dilutions of 1/2, 1/8, 1/32, and 1/128. A control slide (ISO), probed with pre-immune rabbit serum and labeled with IRDye 800 CW conjugated secondary Ab, served as a background control. Panel B. The background-corrected fluorescence of each spot was expressed as integrated fluorescence intensity and plotted against sample dilution.
