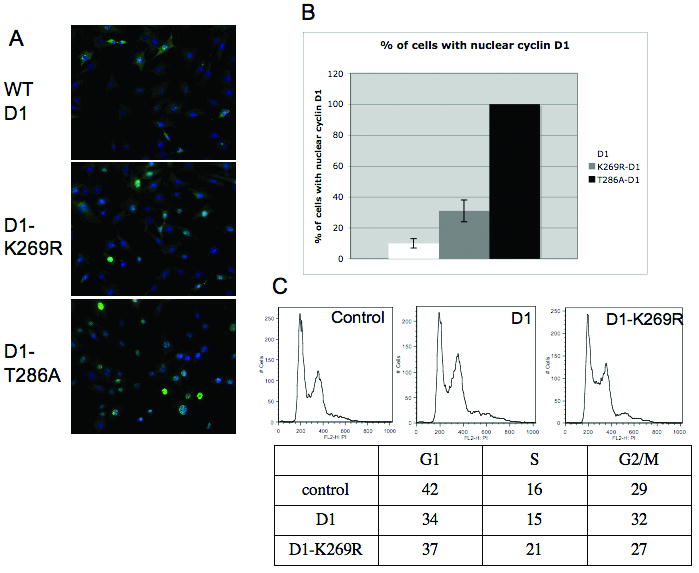
Figure 4. D1-K269R has increased nuclear localization.

A. NIH-3T3 cells stably expressing WT cyclin D1, D1-K269R and D1-T286A were subjected to immunofluorescence analysis with cyclin D1 antibody (green), slides were counterstained with DAPI (blue). B. Quantification of A from three independent experiments (error bars represent standard deviation). C. Cell cycle analysis of asynchronous NIH-3T3 cell lines by PI/FACS.
