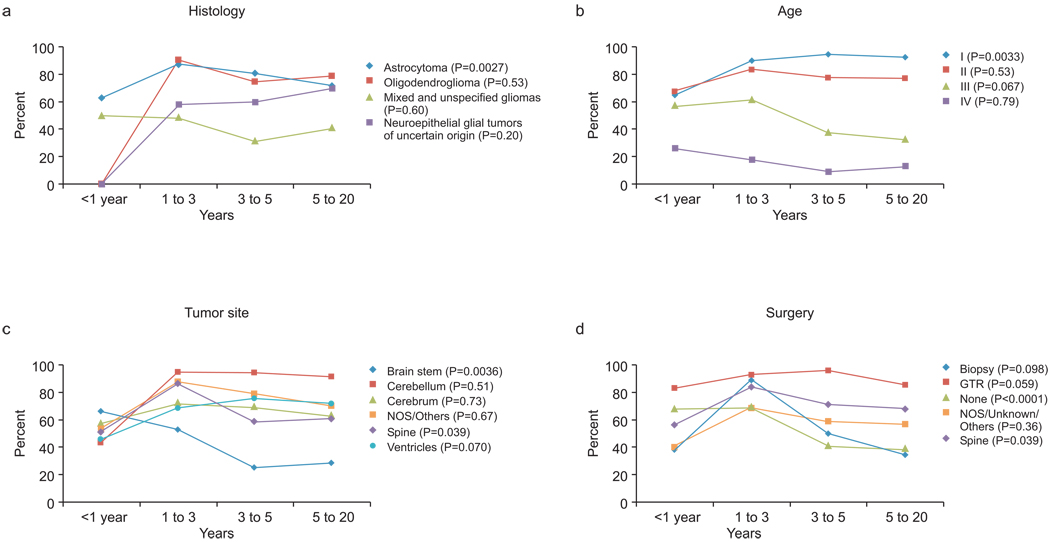
Figure 4.
Line charts comparing the 10-year Kaplan-Meier survival estimates of pediatric patients with gliomas in the 4 age groups according to (A) histology, (B) tumor grade, (C) primary tumor site, and (D) extent of surgery. The log-rank test for trend was used to test the association of age with survival in each subset of patients.

