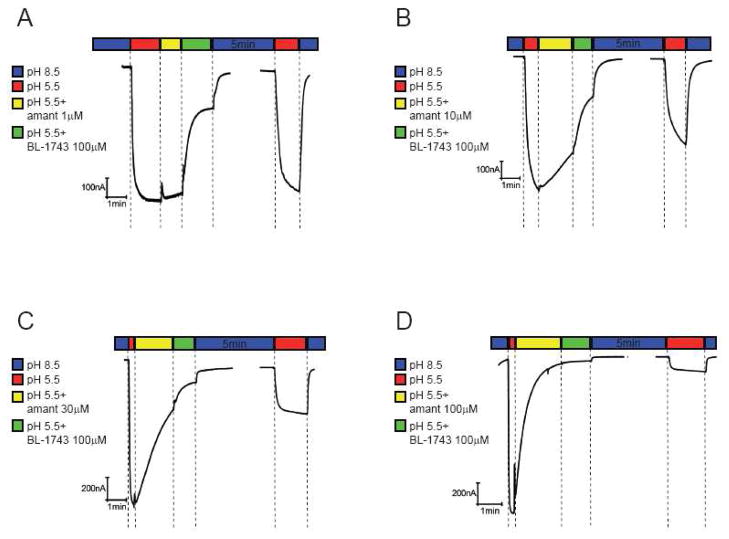
Figure 6. Inhibition of A/M2 channel activity by consecutive application of amantadine and BL-1743.
A–D, Representative traces of the A/M2 channel activity modulated by consecutive application of amantadine and BL-1743. A/M2 channel activity was induced by the application of the activating solution (pH 5.5, red horizontal bars above the traces). The currents were first inhibited by the application of the activating solution (pH 5.5) containing various concentrations of amantadine (1–100 μM, yellow horizontal bar) for 60 sec. After the maximal inhibition of the channel activity was achieved, BL-1743 (100 μM) was substituted for amantadine (1–100 μM) in the activating for 90 sec (green horizontal bar). The inhibitors were washed out for 5min by the non-activating solution (pH 8.5, second blue horizontal bar) and the pH-induced activity of A/M2 channels was measured again (second red horizontal bar). Note that in no instance was a biphasic current observed during application of BL- 1743 as amantadine was washed-out (yellow bars).

