
Table 1.
Inhibition efficiency of the synthesized compounds on A/M2 channels.
 | |||||
|---|---|---|---|---|---|
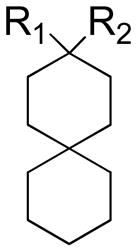
| Compound | R1 | R2 | AM2 channel activity after 100μM compound inhibition | IC50 (μM) | Kd (μM)a |
| Amantadine | 6% | 15.76±1.24 | 15.17 | ||
| BL-1743 | 25% | 45.31±3.92 | 193.54 | ||
| 8 | H | NH3+Cl− | 11% | 12.59±1.11 | 9.16 |
| 9 | H | NH2+Cl−CH3 | 8% | 15.72±1.89 | 46.36 |
| 10 | H |  |
8% | 14.60±1.70 | 11.50 |
| 11 | H |  |
25% | n.d | |
| 12 | H | NH2+Cl−(CH3)2NH3+Cl− | 100% | n.d | |
| 13 | H | NH2+Cl−(CH3)3NH3+Cl− | 100% | n.d | >500 |
| 14 | H | 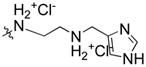 |
91% | n.d | |
| 15 | OH |  |
40% | n.d | |
| 16 | H |  |
13% | 12.54±1.24 | |
| 17 | F |  |
31% | 57.57±2.24 | |
| 18 | H | 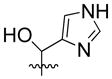 |
30% | n.d | |
| 19 | H |  |
25% | 29.19±1.46 | |
| 20 | 5% | 0.92±0.11 | 12.87 | ||
a
Kd was obtained by global fitting of Circular Dichroism (CD) data of ligand titration to A/M2TM (22–46) using Igor Pro (wavemetrics). The variation of Kd values is ±25% based on different fitting values obtained from three repeats of amantadine titration and two repeats of compound 20 titration. See supplementary information for details.