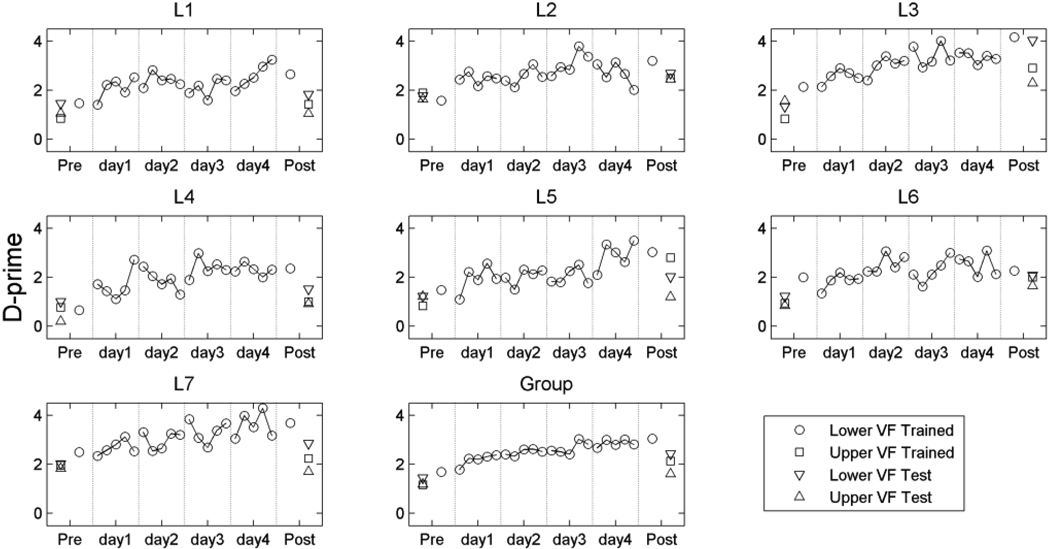
Figure 6.
Block-by-block lexical-decision performance (d’) is shown for the seven trained subjects in the lexical-decision training group and the group average. Each panel shows pre- and post-test results, and also day-by-day training performance. Data are plotted as circles (lower visual field) and squares (upper visual field) for the trained word and non-word set, and upside-down triangles (lower visual field) and triangles (upper visual field) for the testing (untrained) word and non-word set. Data from each of the four training days are divided into five training blocks, with 270 lexical-decision trials in each block. Boundaries between days are indicated by vertical dashed lines.

