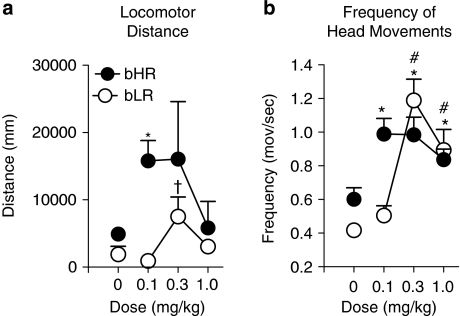
Figure 7.
Psychomotor response to quinpirole. Data are illustrated as the mean+SEM for bHR (n=12, black circles) and bLR (n=12, black circles) rats for each dose examined. Data illustrated at 0 mg/kg represent a separate control group of rats that received saline (bHR, n=10; bLR, n=12). (a) Locomotor distance traveled. (b) Frequency of head movements. *P⩽0.05 bHR vs bHR saline; #P<0.05 bLR vs bLR saline; †P<0.10 bLR vs bLR saline.

