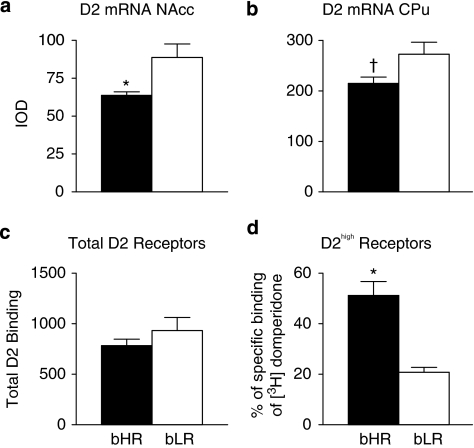
Figure 8.
Dopamine D2 receptor profile in the striatum of selectively bred rat lines. (a and b) Data represent the mean+SEM of relative integrated optical density (IOD) for D2 mRNA in bHR (n=5, black bars) and bLR (n=7, white bars) rats from S14. (a) bHR rats exhibited lower levels of D2 mRNA in the nucleus accumbens (NAcc) and (b) a trend toward lower levels in the caudate putamen (CPu). (c) The mean+SEM of total dopamine receptors indicated by [3H]domperidone binding in the dorsal striatum of bHR (n=5, black bars) and bLR (n=5, white bars) rats from S17. (d) The mean+SEM proportion of D2high receptors (in the same rats used in panel c). There was no significant difference in the total amount of D2 receptors, but bHR rats exhibited a greater proportion of D2high receptors relative to bLR rats. *P<0.05; †P<0.10 relative to bLR rats.

