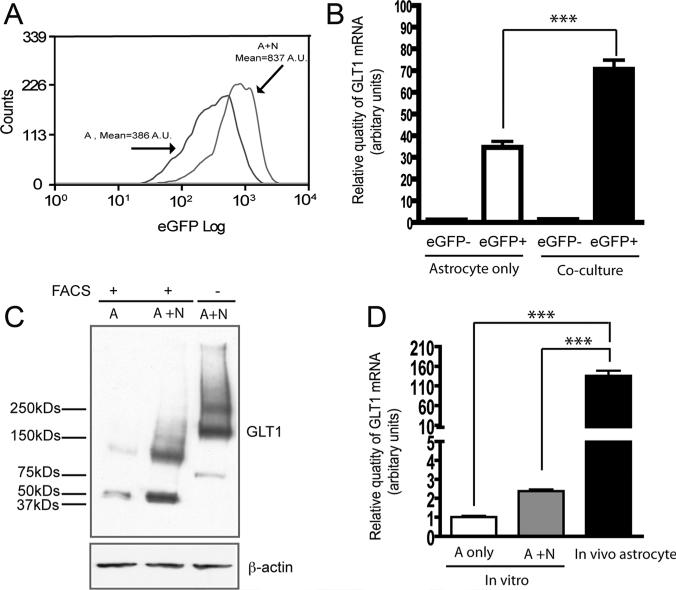
Fig. 2.
Expression of GLT1 mRNA and protein in isolated eGFP+ astrocytes. (A) Histogram overlay of eGFP+ cells from astrocytes cultured alone and astrocyte neuron co-cultures. A, astrocyte alone; A+N, astrocyte and neuron co-culture. (B) Relative GLT1 mRNA levels in eGFP+ and eGFP- cells isolated from astrocyte cultured alone and astrocyte neuron co-cultures (n = 9, ***P < 0.001, one-way ANOVA and Bonferroni test was used). (C) GLT1 protein expression levels in eGFP+ cells from astrocytes cultured alone and astrocyte neuron co-cultures (n = 3) A, astrocyte alone; A+N, astrocyte and neuron co-culture. (D) Relative GLT1 mRNA levels in eGFP+ cells isolated from in vitro astrocyte cultures and mouse adult brain. (n = 9, ***P < 0.001, One-way ANOVA and Bonferroni).

