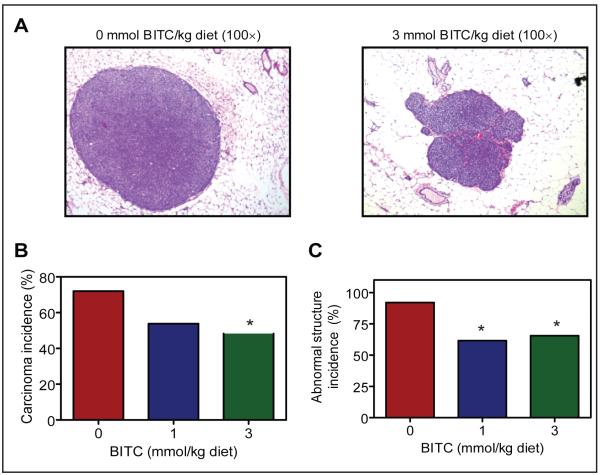
Fig. 2.
A, H&E stained sections depicting mammary carcinoma in a representative mouse of the control group and a mouse of the 3 mmol BITC/kg diet group. B, incidence of carcinoma in the breast tissue of mice of the control group, 1 mmol BITC/kg diet group, and 3 mmol BITC/kg diet group. *,P=0.07 compared with control by Fisher’s test). C, cumulative incidence of abnormal structures in the breast tissue of mice of the control group, 1 mmol BITC/kg diet group and 3 mmol BITC/kg diet group (n= 25 for the control group, n= 26 for the 1 mmol BITC/kg diet group, and n= 29 for the 3 mmol BITC/kg diet group). *,P= 0.01 compared with control by Fisher’s test.

