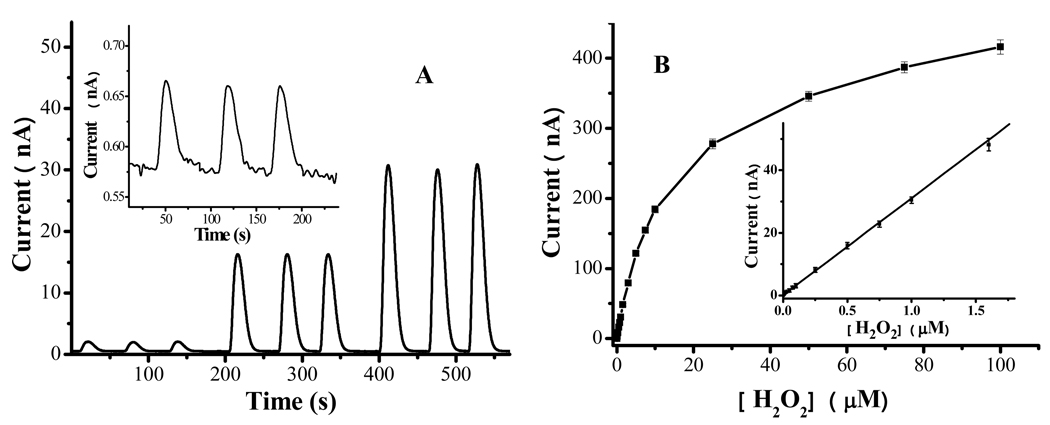
Figure 5.
(A) Amperometric response at an FcC11SH/encapsulated HRP electrode upon consecutive injections of three different H2O2 concentrations (0.05, 0.50 and 1.0 µM). The electrode was held at 0.5 V vs. Ag/AgCl, while the injected H2O2 samples were delivered at 0.08 mL/min. Inset: Amperometric response to three consecutive injections of 1.0 nM H2O2. (B) Dependence of the electrocatalytic current on [H2O2] in the range between 1 nM and 100 µM, i (nA) = 0.029 [H2O2] (nM) + 0.56 (nA). The inset shows the linear portion of the plot (r2 = 0.999 between 1.0 nM and 1.6 µM). Each concentration was repeated three times and the error bars represent the RSD values.

