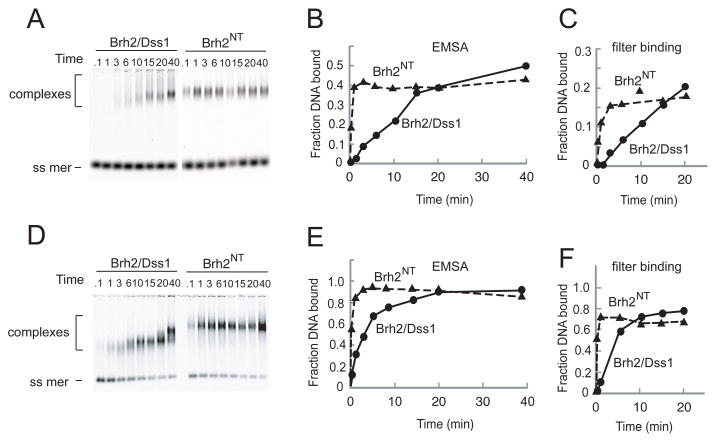
FIGURE 2.
DNA binding rates. Time courses of DNA binding were determined with single-stranded oligonucleotide and Brh2 or Brh2NT. Aliquots were removed from binding reactions at times indicated, mixed with glutaraldehyde, and the DNA analyzed for mobility shift after electrophoresis. The fraction of DNA bound was quantified from the relative intensity of the free and shifted oligomer and is shown graphically below. A. Brh2 or Brh2NT at 20 nM. B. Brh2 or Brh2NT at 100 nM.

