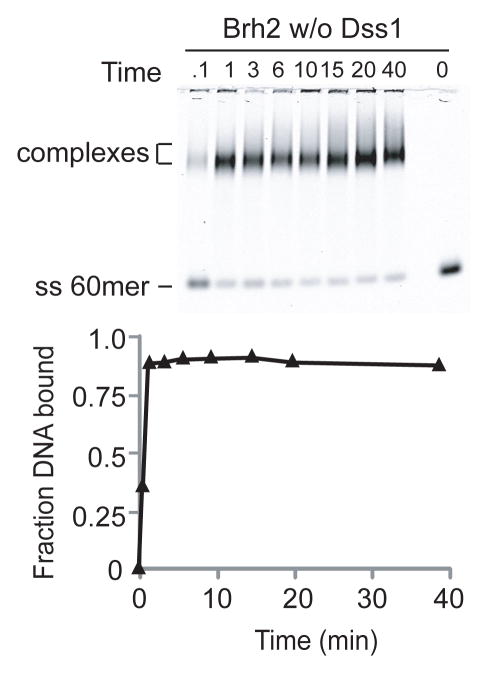
FIGURE 7.
DNA binding rate of Brh2 apoprotein. Time course of DNA binding was determined with IRD800-labeled ss60mer (3.3 nM) and 100 nM Brh2 stripped of Dss1 prepared as described in Material and Methods. Aliquots were removed from binding reactions at times (min) indicated, fixed with glutaraldehyde, and the DNA analyzed for mobility shift after electrophoresis. For the zero time point, DNA was added to a Brh2 reaction mixture already containing glutaraldehyde.

