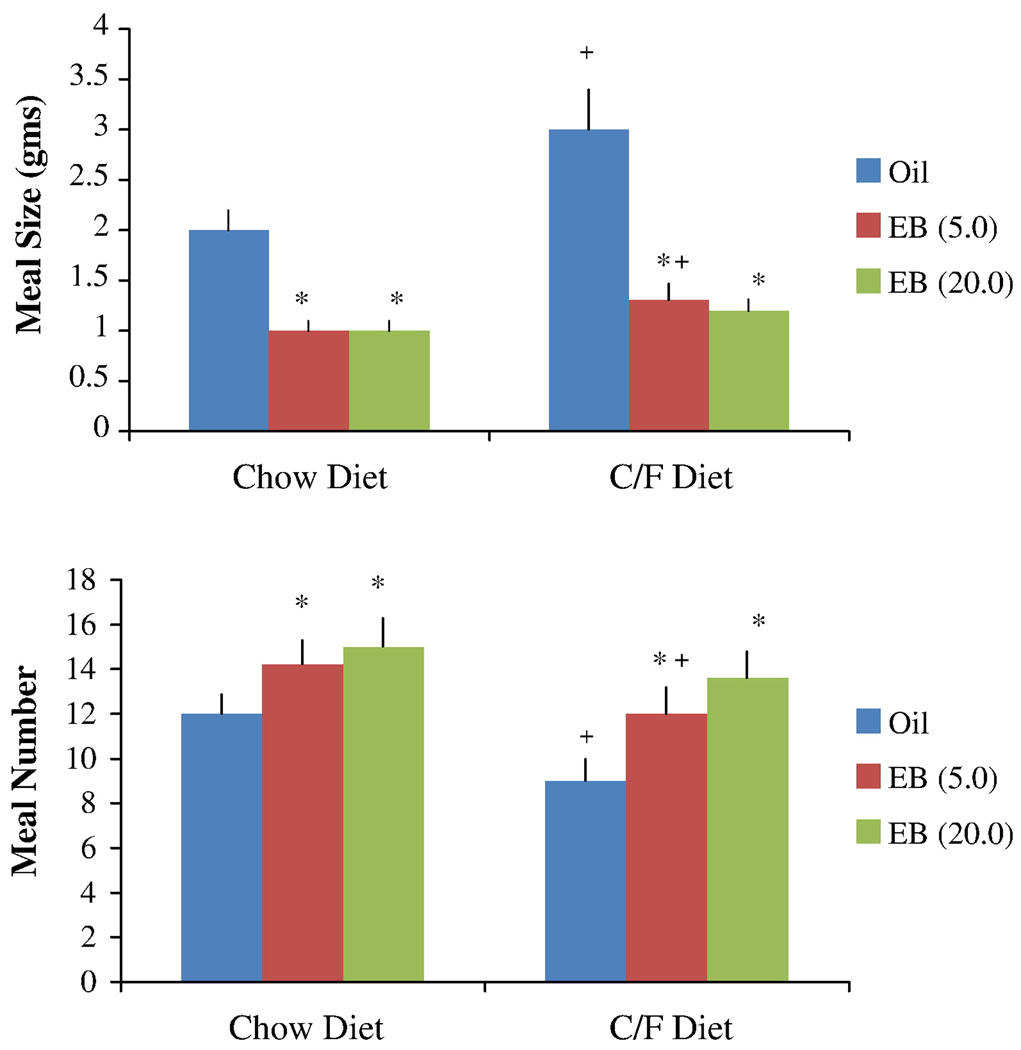
Figure 2.
Effects of oil and EB injections (5.0 or 20.0 µg) on average meal size (upper panel) and meal number (lower panel) following exposure to the standard chow diet and the chocolate/fat (C/F) diet. The data were obtained from the 23-h period three days after the first oil or EB injection. Bars represent means ± SE meal size and meal number. * Significantly different from oil treatment (P < 0.05); and + significantly different from chow diet (P < 0.05).

