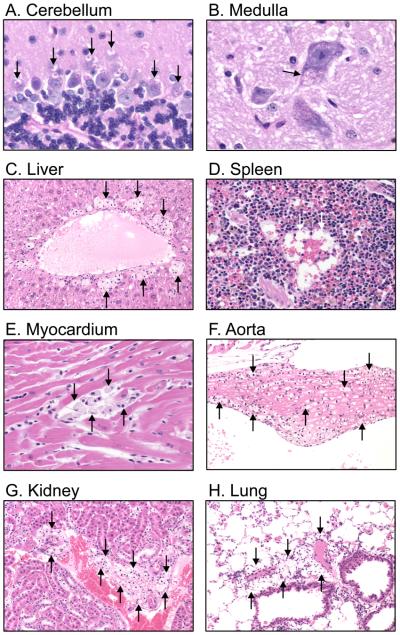
Figure 3.
Representative histopathology of tissues from 30-week-old Idua-W392X mice. Arrows indicate inclusions representing GAG accumulation in (A) the cytoplasm of Purkinje cells in the cerebellum; and (B) the cytoplasm of a neuron in the medulla. Foamy macrophages distended by GAG accumulation are observed in (C) liver, (D) spleen, (E) myocardium, (F) aorta, (G) kidney, and (H) lung. Panels A and B were stained with PAS-hematoxylin, original magnification 80X; Panels C, F, G, and H were stained with HE, original magnification 20X; Panels D and E were strained with HE, original magnification 40X.

