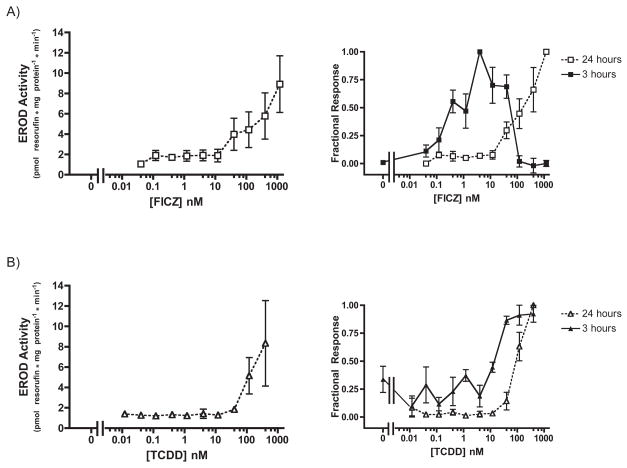
Fig. 6. Dose-dependent induction of CYP1A activity by FICZ and TCDD in XLK-WG: 24 hour treatment.
Cells were exposed to FICZ (A) or TCDD (B) at the indicated concentrations for 24 hours before CYP1A activity was measured. Plotted according to EROD activity (left) and percentage of maximal response (right). n=3 for FICZ, n=2 for TCDD. Error bars = SE.

