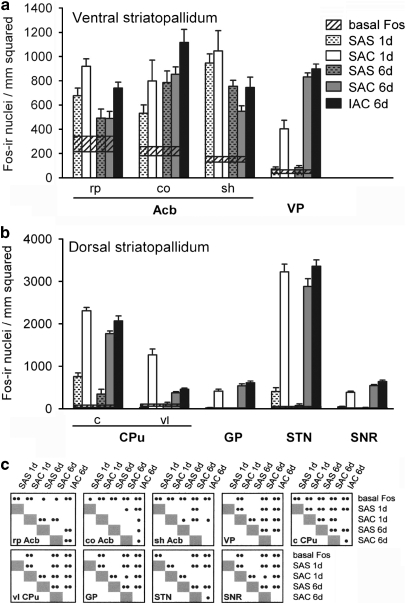
Figure 6.
Graphs illustrating the density of Fos-immunoreactive nuclei in the ventral striatopallidum (a), including the accumbens (Acb) and ventral pallidum (VP), and dorsal striatopallidum (b), including the caudate-putamen (CPu), globus pallidus (GP), subthalamic nucleus (STN), and substantia nigra reticulata (SNR), for the experimental groups as described in the text. Means and SEMs are shown (c) Cross-referenced results of ANOVA and LSD post hoc tests. •p<0.05; ••p<0.01. Widths of the horizontal bars reflect the magnitude of the SEM above and below the mean for ‘basal Fos' expression. c, central division of CPu; co, Acb core; IAC, investigator-administered cocaine; rp Acb, rostral pole; SAC, self-administered cocaine; SAS, self-administered saline; shvAcb, shell; vl, ventrolateral division of CPu.

