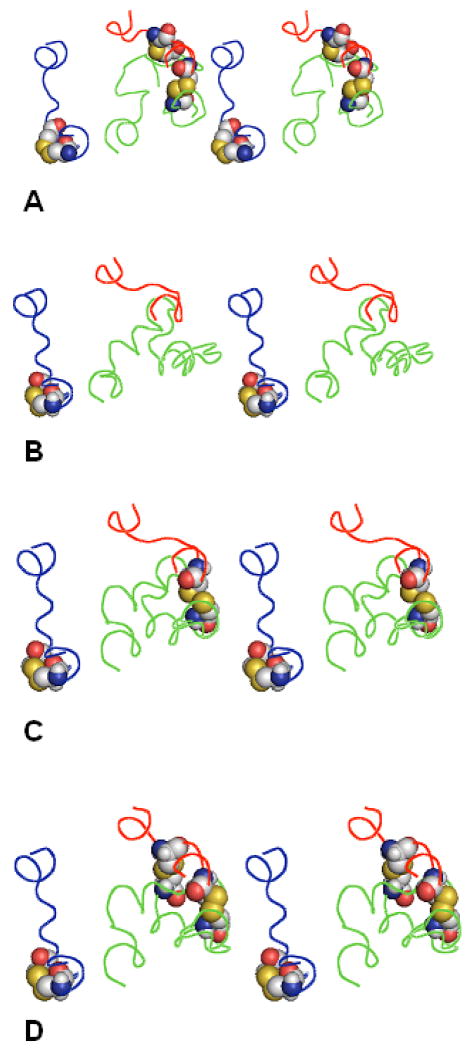
Figure 3.
Forming the system of additional disulfide bridges between the EC loops in A2AR. The EC loops are shown as lines in red (EC1), green (EC2) and blue (EC3). Residues C71, C74, C146, C159, C259 and C262 are shown as space-filled models. A) the X-ray structure; B) calculated structure with the best rms values,C259-C262 bridge added; C) calculated structure with the best rms values, C74-C146 bridge added; D) calculated structure with the best rms values, C71-C159 bridge added. The view is from the extracellular space normal to the membrane plane.

