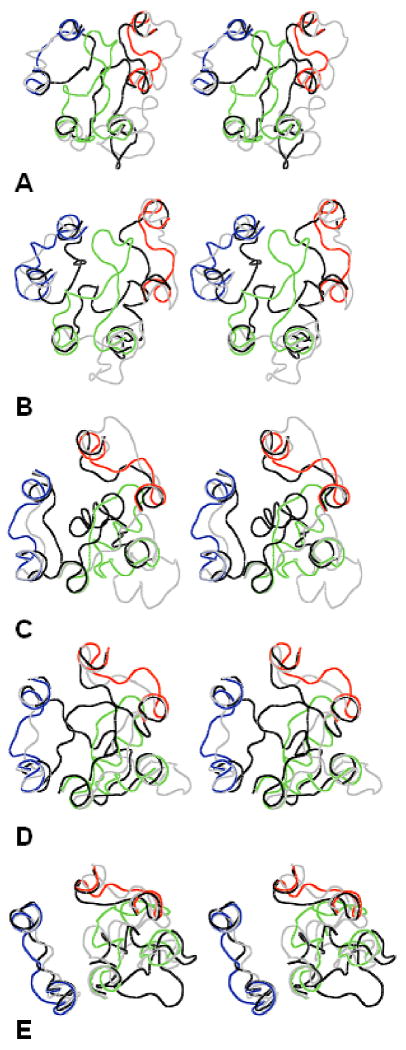
Figure 4.
Stereoviews of the X-ray structures of the EC loops shown as lines in red (EC1), green (EC2) and blue (EC3) overlapped with the most open (gray lines) and most closed (black lines) calculated structures. A) bRh; B) sRh; C) b2AR; D) b1AR; E) A2AR. The view is from the extracellular space normal to the membrane plane.

