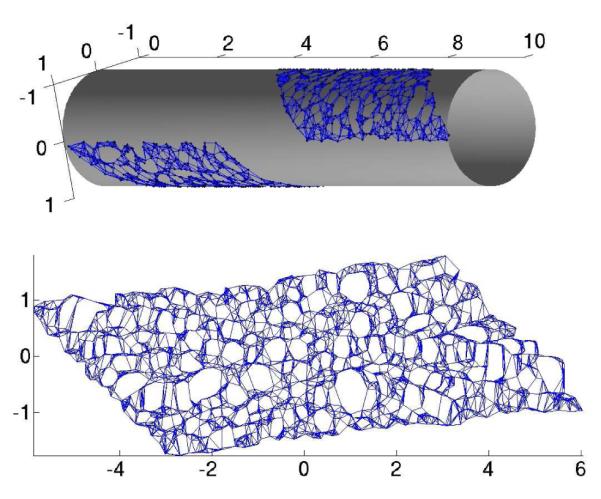
Fig. 1.

The Isomap algorithm. Top: An intrinsically non-linear 2D data set, given as 3D data. The neighborhood graph is overlaid for illustration. Bottom: The resulting two-dimensional embedding coordinates for each point, as resulting from the application of the Isomap algorithm. The neighborhood graph is overlaid for comparison.
