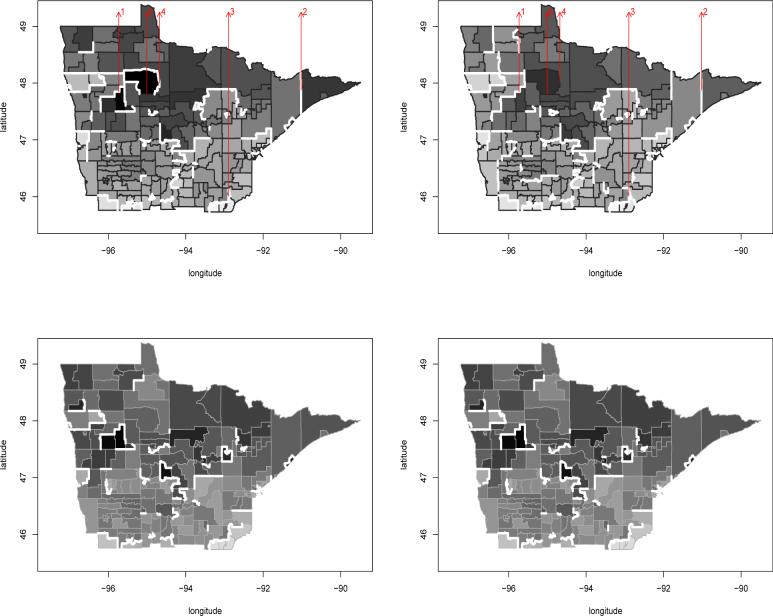
Figure 4.
Areal wombling boundaries (thick white lines), MCSS colorectal and prostate cancer data. Left panels, colorectal cancer; right panels, prostate cancer. Top row, spatial residual surface; bottom row, fitted log intensity surface. The five arrows indicate candidate areal wombling boundaries to be tested for significance in the text.

